North Carolina Pamlico Sound Trawl Survey
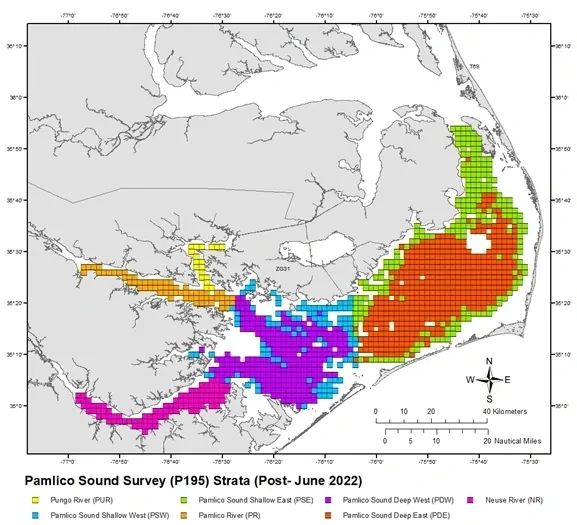
The North Carolina Pamlico Sound Survey (PSS) is a United States Fish and Wildlife Service Sport Fishing Restoration funded fishery independent bottom trawl survey conducted by the North Carolina Division of Marine Fisheries (NCDMF) since 1987. As a program component of both SEAMAP South Atlantic and NEAMAP, the PSS was initially designed to provide long-term, fishery independent data on the distribution, relative abundance, and size composition of estuarine fish and decapod crustaceans for the waters of the Pamlico Sound, eastern Albemarle Sound and the lower Neuse and Pamlico rivers. In 1990, all sampling in the Albemarle Sound and March and December sampling was eliminated (Figure 1). Current sampling occurs only in the Pamlico Sound and adjacent rivers and bays over a two-week period in June and September annually (Figure 2).
Survey Design
A stratified random sampling design is used to randomly select 54 grids in June and September for a total of 108 grids trawled each year. Sampled grids are randomly selected from seven strata based on depth and geographic location. The seven designated strata are: Neuse River, Pamlico River, Pungo River, shallow and deep Pamlico Sound east of Bluff Shoal , and shallow and deep Pamlico Sound west of Bluff Shoal (Figure 1 & 2). Shallow water is defined as having a depth between 6-12ft (1.8-3.7m) and deep water is defined as having a depth greater than 12ft (3.7m). Beginning in March 1989, the randomly drawn grids are optimally allocated among the strata based on previous sampling (from 1990-present) to provide the most accurate abundance estimates. Prior to 1989, grids were allocated in proportion to the size of the strata, see the “Data Acknowledgment, Caveats, and Protocols: NC-PSS” document for strata weights used by year.
At each grid, double rigged 30ft demersal mongoose trawls are deployed from the R/V Carolina Coast and towed during daylight hours for a duration of 20 minutes at 2.5 knots, sweeping an area of approximately 97,500 square feet per net (these numbers are estimates only and have not been verified in a flow tank or with net sensors). Environmental data taken at each grid includes weather description, light phase, surface and bottom temperature (°C), surface and bottom salinity (ppt), surface and bottom dissolved oxygen (mg/L), start time, secchi depth (cm), wind speed (knots), wind direction, precipitation, start and end latitude, and start and end longitude (deg, min, sec). Observations of weather, shoreline, and sediment composition are also noted.
Catches from the two nets are combined to form a single sample to reduce variability. All species are sorted, and the total number and weight is recorded for each species. For target species (Table 1), a minimum of 30 specimens are measured and total weights are recorded. All target species are measured if less than 30 specimens are sampled. Blue crab is unique in that a minimum of 100 individuals are measured and sex, maturity, and sponge color are recorded. Horseshoe crabs are also sexed. Fish, including non-target species, with abnormalities or signs of disease are recorded as a separate collection. Total weight and count of all diseased individuals are recorded and all specimens, or at least 30, are measured.
At the conclusion of each survey, a report is completed summarizing species composition, abundance, and size distributions. Exceptions to the sampling schedule have occurred over the years, often due to weather related issues such as hurricanes and boat maintenance. Refer to Table 2 for details about sampling deviations and other survey changes.
")
Data Acknowledgment and Caveats
For guidance on data acknowledgement, caveats, and a more detailed description of the methods used see the Data Acknowledgment, Caveats, and Protocols: NC-PSS. This document provides critical information regarding the use of NC-PSS data and should be read in full before querying this data. Each requestor is solely accountable for any further analysis, manipulation, or presentations. It is also the responsibility of the data user to cite and acknowledge SEAMAP and the NCDMF Pamlico Sound Survey.